


Revenue Per Technician: The Ultimate Guide to Benchmarking and Increasing Your Team's Output
Calculate revenue per technician, compare 2026 benchmarks ($180K-$250K HVAC), and implement call qualification fixes that boost productivity 25%+.

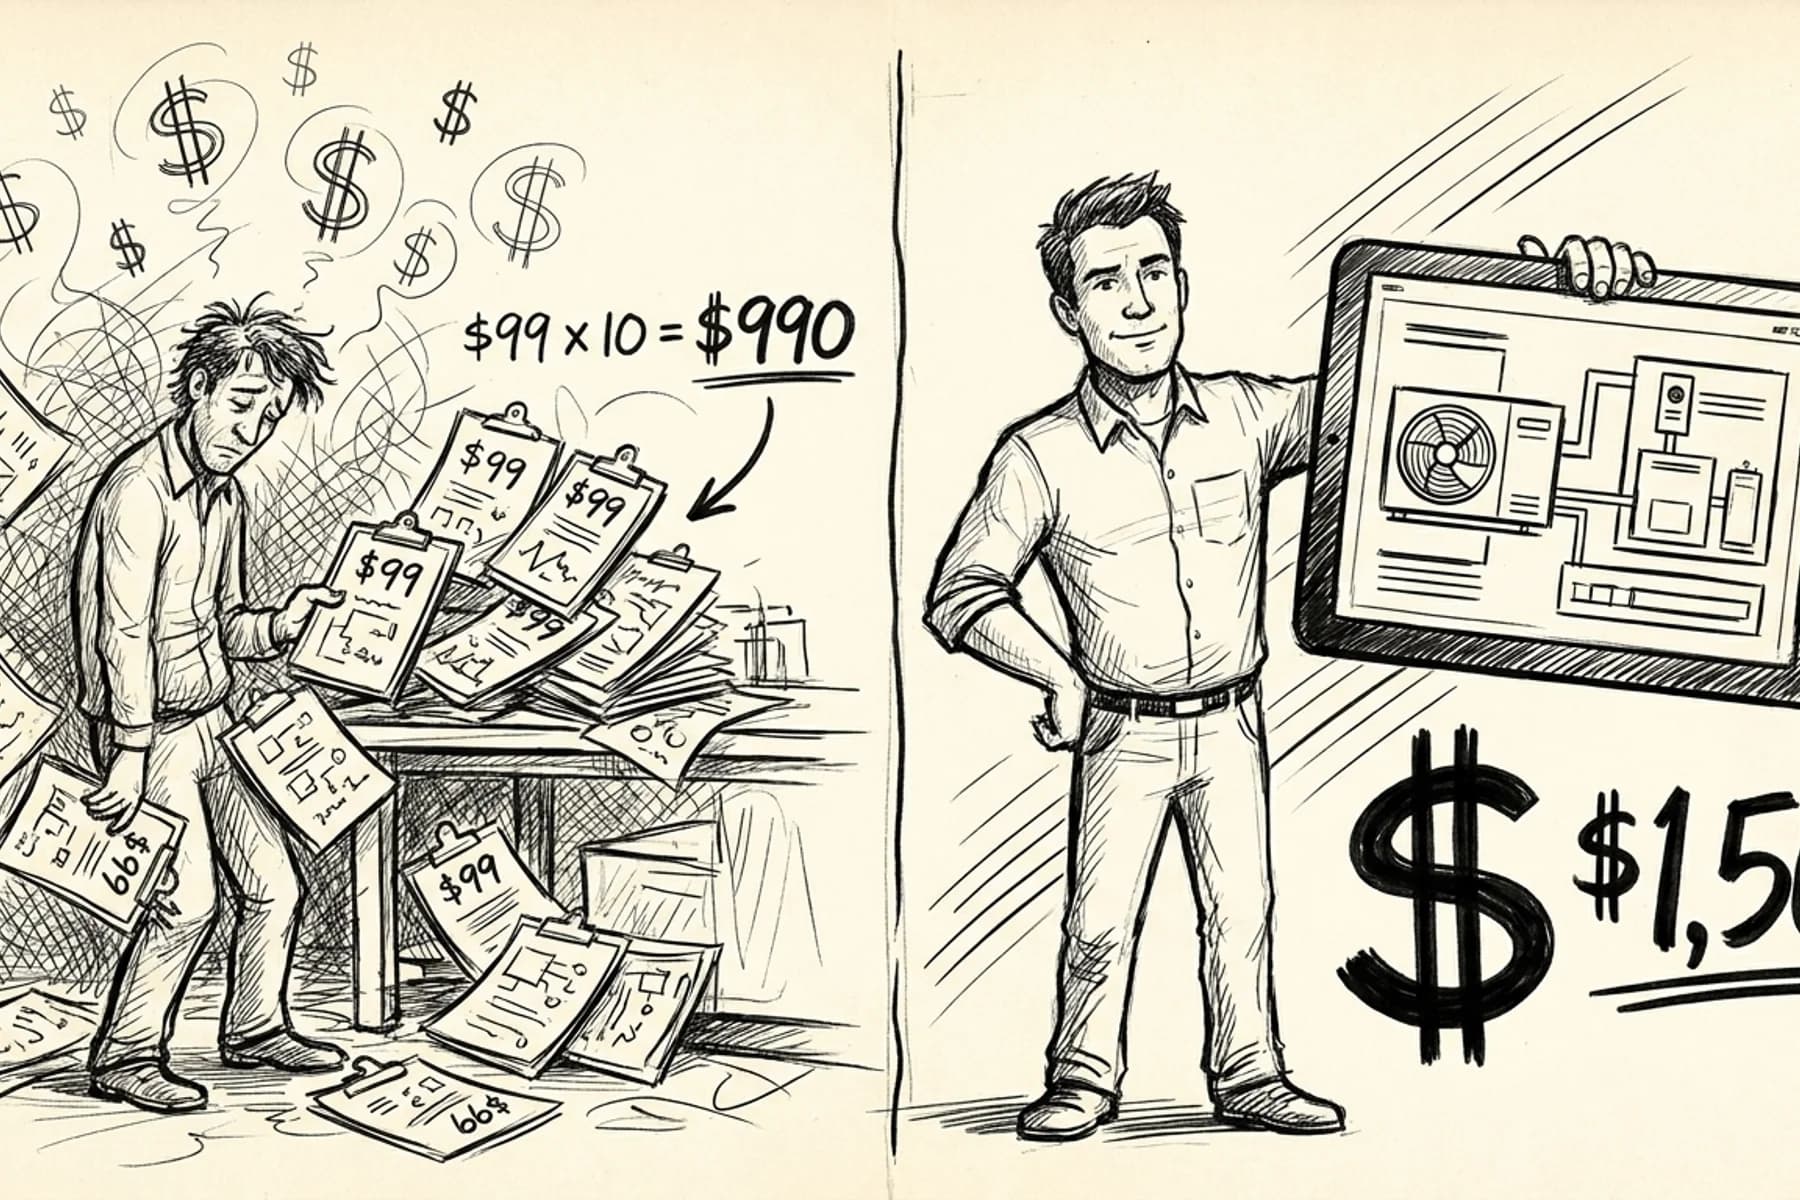
Stop Sending Techs to $99 Tune-Ups: The Complete Guide to Revenue Per Technician Optimization
Your top technician just finished a 10-hour day. Four service calls, $420 in total revenue. Your competitor's tech? Same day, three calls, $780.
The difference isn't skill. It's job mix.
Revenue per technician isn't just a metric—it's your best early warning system for operational problems and your fastest path to profitability. A tech generating $180K annually on 1,200 service calls is bleeding money compared to one hitting $220K on 800 calls.
Revenue Per Technician is the total billable revenue generated by a field technician divided by time period, measuring productivity and job mix quality rather than just activity volume.
Most shops track total revenue and call it good. Wrong move. Overhead scales with headcount. Per-tech productivity drives your actual margin.
Why revenue per technician matters more than total revenue
Revenue per technician reveals operational efficiency while total revenue can mask declining productivity with added headcount. Per-tech productivity tells the real story.
I watched a 12-tech HVAC shop celebrate hitting $2.4M in annual revenue. Sounds solid until you do the math: $200K per tech. Industry average. Meanwhile, their competitor ran 8 techs at $250K each for $2M total—but 25% higher margins.
Here's why this metric cuts through the noise:
The hidden costs of low-value service calls: A $99 tune-up takes the same 45 minutes of drive time as a $400 repair call. Your tech's daily capacity is fixed. Fill it with low-value work and your margin disappears.
Poor job mix masks productivity problems: Growing call volume looks good on paper. But if you're dispatching techs to routine maintenance while competitors handle emergency repairs, you're losing the efficiency game.
This metric predicts cash flow: Revenue per technician drops before total revenue does. It's your canary in the coal mine for operational issues.
The math is brutal but simple. Cost per booked job includes marketing spend, but your techs determine what happens after the phone rings.
How do you calculate revenue per technician in home services?
Revenue per technician equals total billable revenue divided by the number of field technicians over your chosen time period. Focus on billable revenue only—exclude administrative fees, parts markups, and office overhead.
Basic calculation: Total annual revenue ÷ Number of field technicians = Revenue per technician
Example: $1.8M revenue ÷ 8 techs = $225K per technician annually
Advanced calculation: For deeper insight, track billable revenue per billable hour:
Billable revenue ÷ Total billable technician hours = Revenue per billable hour
This version accounts for vacation time, training, and administrative hours that aren't revenue-generating.
What to include: Service calls, installations, repairs, emergency work—anything a customer pays for directly.
What to exclude: Parts markup (unless you're tracking gross profit per tech), administrative fees, warranty work performed for free, training time, vehicle maintenance.
Track both annual and quarterly metrics. Seasonal businesses need quarterly visibility to spot trends and adjust before problems compound.
What is the average revenue per technician for HVAC companies?
HVAC technicians generate $180K-$250K annually in 2026, with top-quartile residential shops hitting $250K+ per tech. Plumbing runs slightly lower at $160K-$220K, but emergency-focused shops trend higher.
Top-quartile residential HVAC shops generate $250K+ per technician annually while the median sits closer to $200K, according to industry data from Oryx Horn's HVAC job costing analysis. Understanding hvac revenue per tech helps owners identify performance gaps and optimization opportunities.
HVAC technician revenue benchmarks by region:
- Southeast/Southwest: $190K-$270K (higher cooling demand)
- Northeast: $170K-$240K (seasonal variation)
- Midwest: $160K-$230K (balanced heating/cooling)
- West Coast: $200K-$280K (higher labor costs, premium pricing)
What are good productivity benchmarks for plumbing technicians?
Plumbing technician productivity standards: Emergency plumbing generates higher per-tech revenue than scheduled maintenance. Shops focused on water heater replacement and drain clearing hit the higher end of ranges. Tracking plumbing kpis alongside plumbing technician revenue helps identify which service types drive the strongest margins.
The performance gap between average and elite is $40K-$70K per technician. That's not luck. It's system design.
Want context for these numbers? Check our HVAC technician salary benchmarks to see how compensation correlates with productivity.
Strategy 1: Improve job qualification and dispatch
Better call qualification prevents techs from wasting time on low-value work. A $99 tune-up consumes the same travel time as a $400 repair but generates 60-80% less revenue. This directly impacts hvac technician productivity by forcing skilled workers into low-margin tasks.
Why $99 tune-ups kill per-tech productivity: Your tech spends 45 minutes driving to a routine maintenance call. Another 30 minutes on-site. That's 75 minutes of capacity. The revenue? Just $99 gross.
Compare that to an emergency repair: Same 45-minute drive, but 90 minutes on-site for $450 revenue. The math isn't close.
How to qualify calls for revenue potential: Train your CSRs to ask qualifying questions that identify job scope before dispatch:
- "How long has this been an issue?" (Emergency vs. maintenance)
- "What exactly is happening with the system?" (Diagnosis complexity)
- "Is the system working at all right now?" (Urgency level)
Using AI to filter low-value calls automatically: AI call qualification can route routine maintenance to dedicated lower-cost channels while ensuring high-value calls reach your best techs immediately.
The result? Your techs spend more time on profitable work, and your revenue per technician climbs.
Strategy 2: Optimize your service mix
Installation jobs generate 80-100 billable hours versus 2-4 hours for service calls. Shifting from 70% service/30% install to 50/50 can increase revenue per tech by $40K+ annually.
The profitability hierarchy: Installations > Repairs > Maintenance
New HVAC installation: 16-20 hours, $8K-$15K revenue
System repair: 2-6 hours, $300-$800 revenue
Maintenance call: 1-2 hours, $99-$200 revenue
The leverage is obvious. One installation equals the revenue of 20-40 maintenance calls.
How to shift toward higher-revenue work: Focus on replacement opportunities during service calls. Train techs to identify systems near end-of-life and document findings for follow-up.
Training CSRs to spot installation opportunities: Your phone team needs CSR training strategies that help them identify replacement calls during initial qualification.
Questions like "How old is your current system?" and "Have you had multiple repairs lately?" can flag potential installation opportunities before dispatch.
Strategy 3: Reduce travel time and improve routing
Every hour of windshield time is lost revenue. Target 75%+ billable time by clustering jobs geographically and optimizing daily routes.
The hidden cost of windshield time: Your tech earns $30/hour in wages. Factor in vehicle costs, insurance, and overhead, and drive time costs $45-$60 per hour with zero revenue generation.
Geographic clustering strategies: Schedule morning calls in one area, afternoon calls in another. Avoid crisscrossing the service territory. This alone can save 30-45 minutes of drive time daily.
Same-day booking for efficiency gains: Emergency calls generate premium revenue and reduce scheduling complexity. Strong call qualification lets you identify true emergencies that justify same-day dispatch.
Result: Higher revenue per call, better capacity utilization, lower vehicle costs.
Strategy 4: Implement performance-based compensation
Revenue-based bonuses motivate techs to focus on higher-value work while maintaining base salary security. Track both revenue and customer satisfaction to prevent aggressive upselling.
Revenue-based bonuses vs. flat hourly pay: Straight hourly compensation rewards time spent, not value delivered. A tech making $25/hour has no financial incentive to complete calls efficiently or identify additional revenue opportunities.
Add a 2-3% revenue bonus and that same tech now cares about job mix and completion time.
Structure incentives that align with goals:
- Base salary: 70-80% of total compensation
- Revenue bonus: 2-3% of billable revenue generated
- Customer satisfaction bonus: Flat monthly amount for maintaining ratings
Avoiding commission-only pitfalls: Pure commission creates income volatility that drives turnover. Base salary plus performance bonuses provides security while rewarding productivity.
Strategy 5: Track and act on real-time performance data
Monitor average ticket size, job completion time, and customer retention alongside revenue per technician. These home service business metrics combined with technician productivity benchmarks give you complete visibility into operational performance. Monthly performance reviews allow quick corrections before quarterly results suffer.
Key metrics beyond revenue per tech:
- Average ticket size (revenue per call)
- Billable hours percentage (drive time efficiency)
- Customer callback rate (quality indicator)
- First-call resolution rate (efficiency measure)
Spot declining performance early: Weekly dashboard reviews catch problems while they're fixable. A tech whose average ticket drops from $380 to $320 needs attention before the quarterly review.
Using FSM data for optimization: Your field service management system tracks this data automatically. FSM integration best practices show how to use this visibility for real-time dispatch decisions.
How can I increase my technician's revenue output?
The five strategies above work together to boost technician revenue: improve call qualification to eliminate low-value work, optimize service mix toward higher-revenue installations, reduce drive time through better routing, align compensation with productivity goals, and track performance metrics for continuous improvement.
Putting it all together: Your 90-day action plan
Start with call qualification—it delivers the fastest ROI with minimal investment. This strategic approach will increase revenue per employee home service while maintaining operational stability. Focus on one improvement at a time to avoid overwhelming your operations.
Month 1: Baseline measurement and call qualification
- Calculate current revenue per technician using the methods above
- Implement basic call qualification questions for CSRs
- Track weekly performance to establish baseline trends
Month 2: Service mix optimization and routing
- Train techs to identify replacement opportunities during service calls
- Implement geographic clustering for daily dispatch
- Measure improvement in average ticket size and billable time percentage
Month 3: Performance tracking and compensation alignment
- Launch revenue-based bonus structure
- Implement monthly performance reviews with key metrics
- Measure overall improvement in revenue per technician
The goal isn't perfect execution on day one. It's systematic improvement over 90 days.
Most shops leave $40K-$70K per technician on the table through poor job qualification and inefficient routing. Fix those two things and your revenue per technician jumps 20-25%.
Stop sending your best techs to $99 tune-ups. Get the demo and see how AI call qualification keeps your techs focused on profitable work.
Keep reading
 Salary & Workforce
2026 HVAC Dispatcher Salary Guide: What It Really Costs (Base Pay, Overtime & Turnover)
9 min read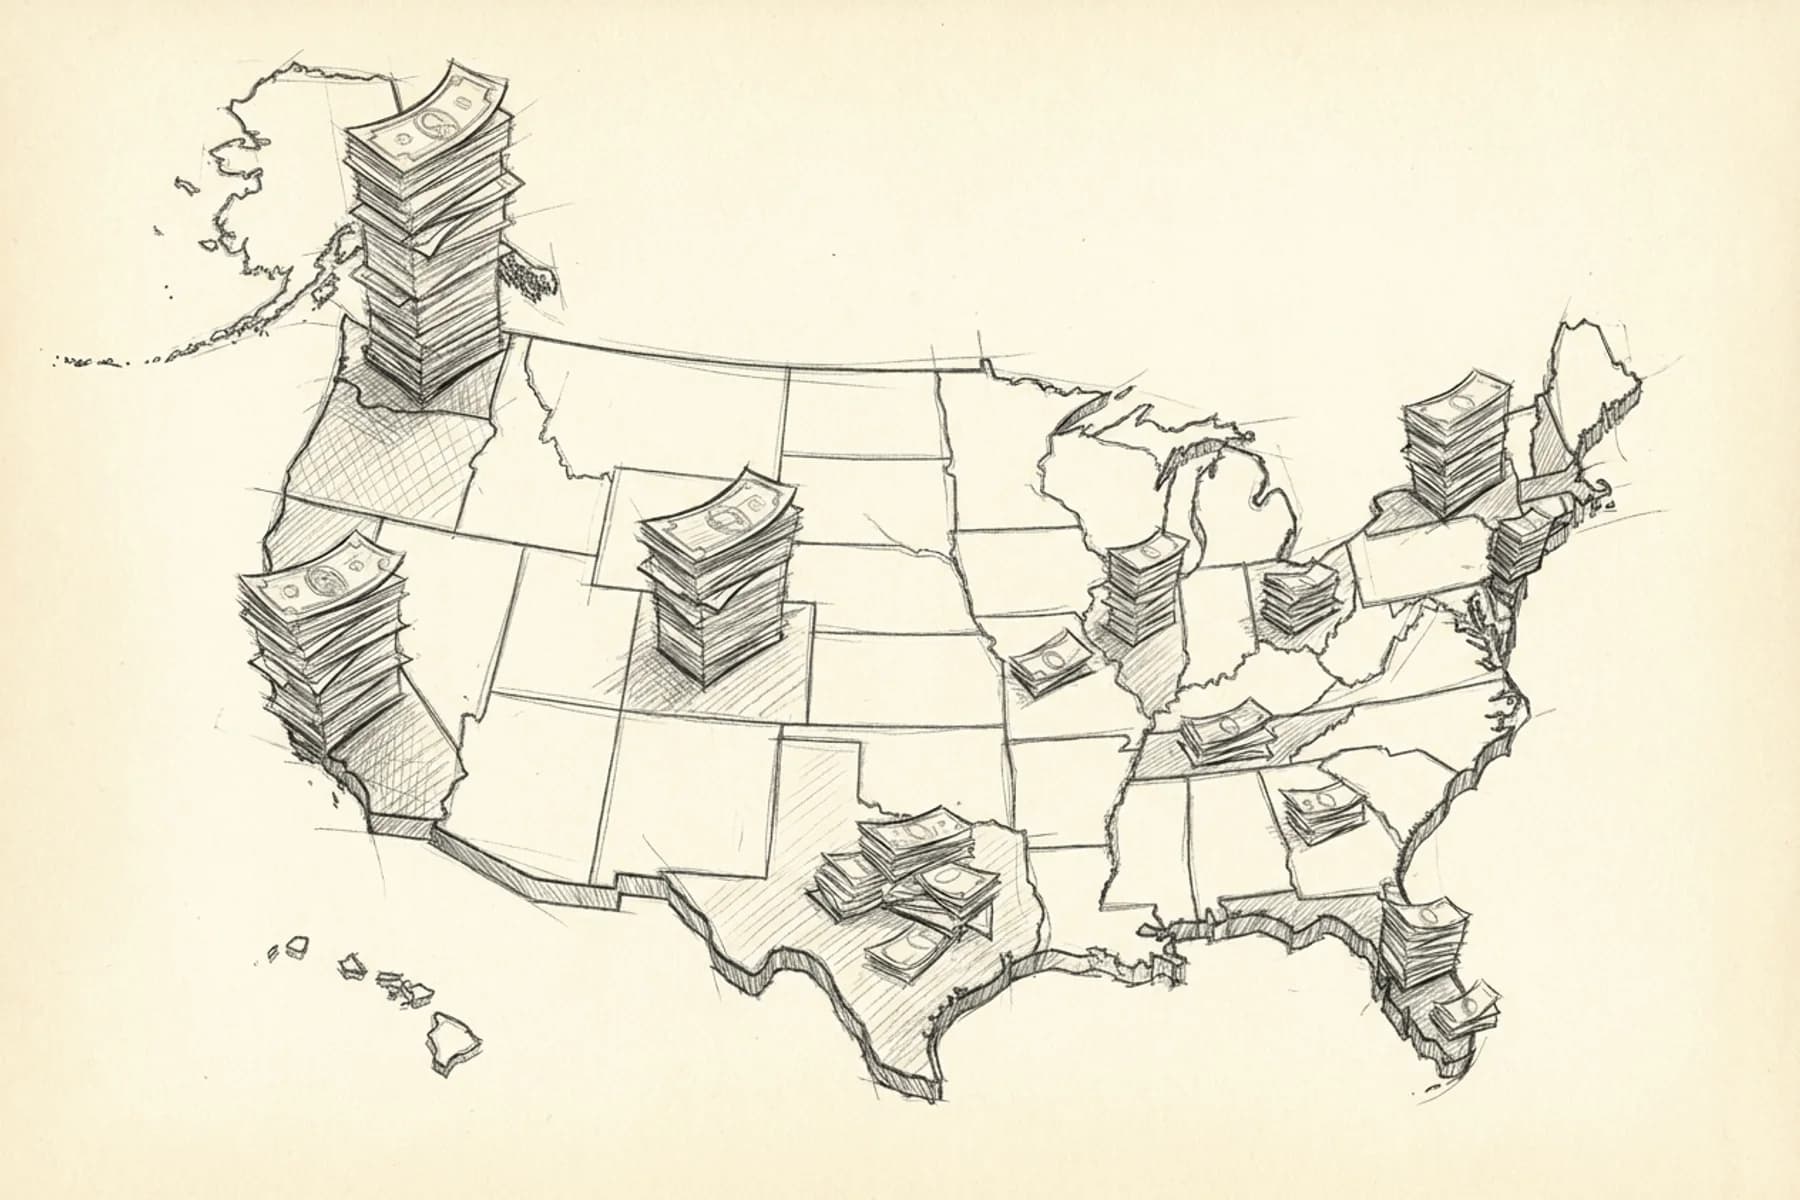 Salary & Workforce
The Ultimate 2026 HVAC Technician Salary Guide (State-by-State Data)
7 min read Salary & Workforce
Your Best Techs Are Quitting Because Your CSRs Are Booking Bad Jobs
7 min read