


The Contractor’s Job Costing Cheatsheet: A 5-Step Template to Guarantee Profit on Every Job
Jun 2, 2026

The Contractor’s Job Costing Cheatsheet: A 5-Step Template to Guarantee Profit on Every Job
The Contractor's Job Costing Cheatsheet: 5 Steps to Lock In Profit Before the Truck Leaves
Your job costing is lying to you
Most contractors I talk to think they're running 30-35% margins. They're running closer to 5%. That gap is where the truck payments, the bonuses, and the retirement plans go to die.
Here's the truth nobody wants to hear: a busted contractor job costing template isn't an accounting problem. It's an operations problem. And it starts the second the phone rings, not when the invoice gets cut. Real job costing for contractors is about closing the gap between what you quoted and what the job actually cost you, every single time.
The false win
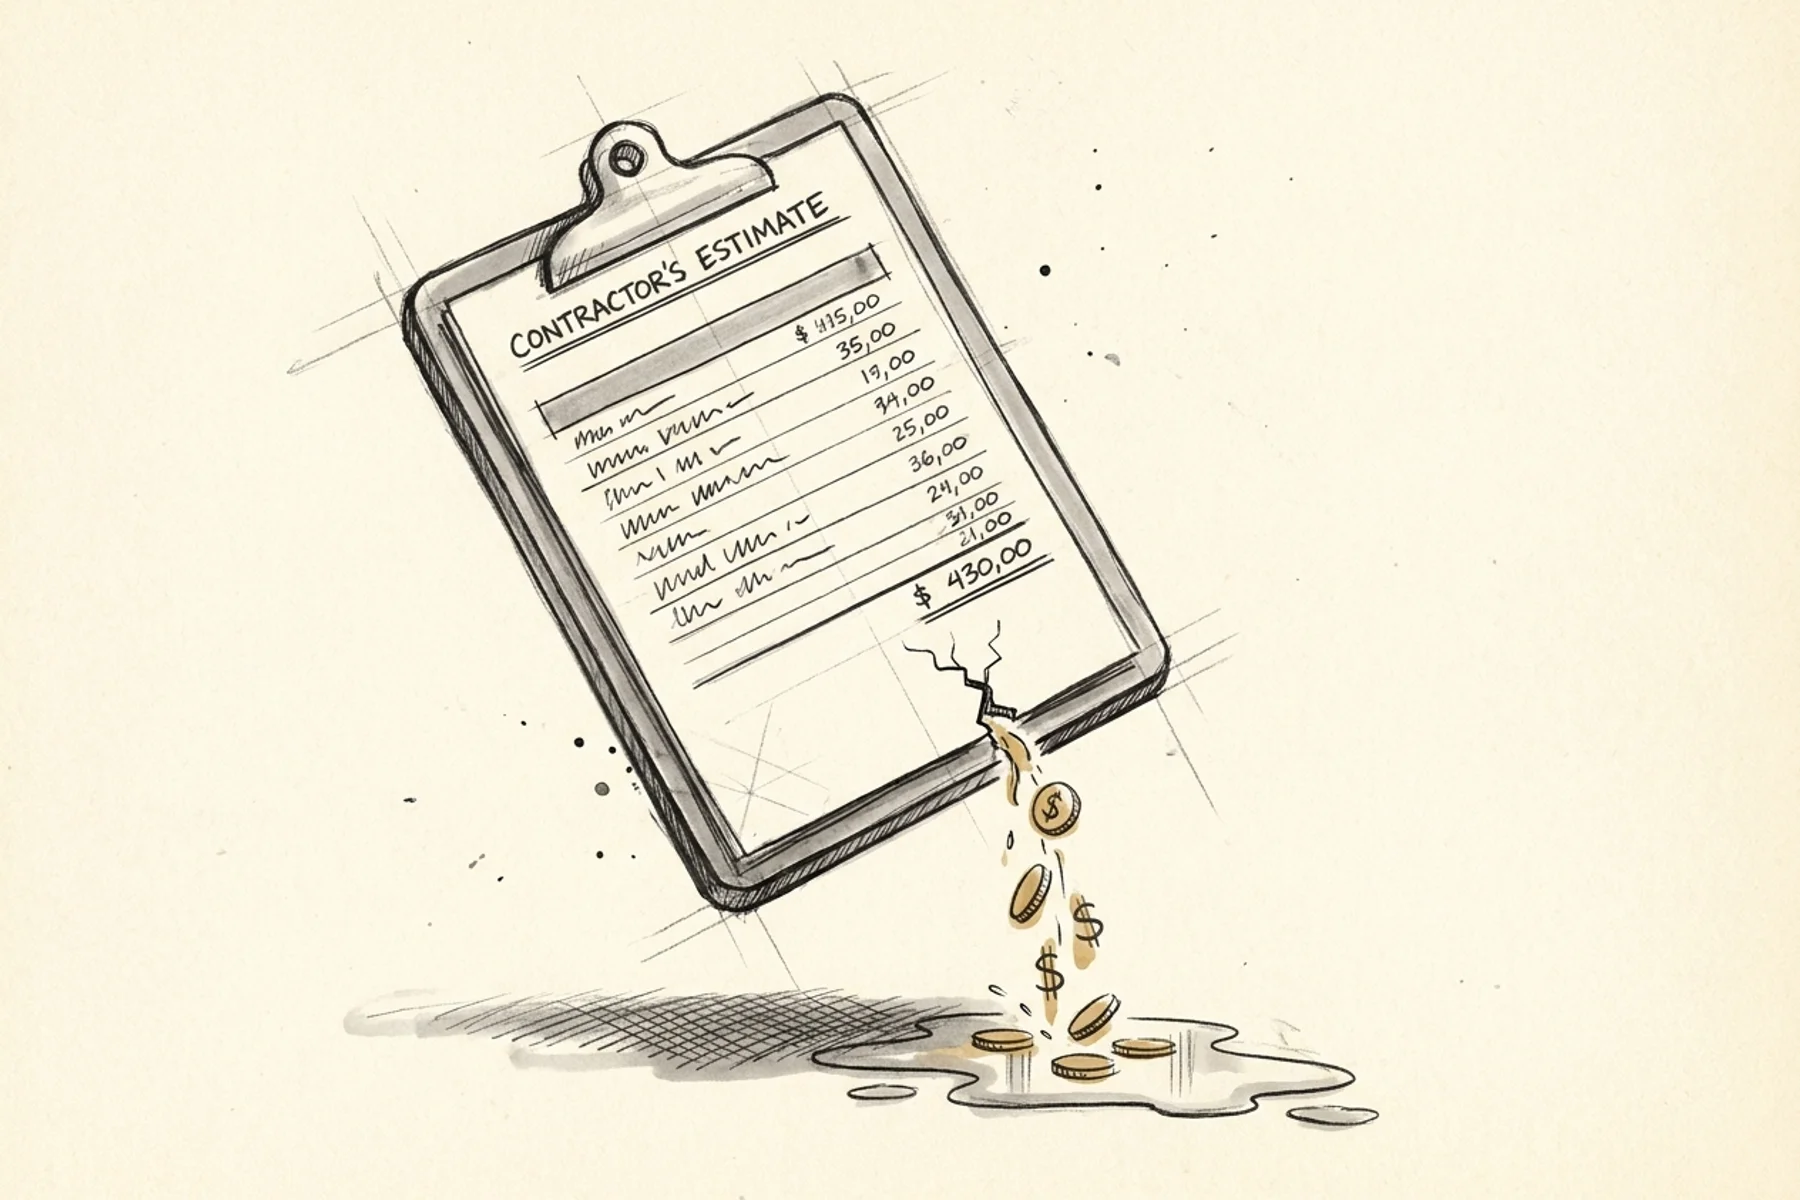
The false win is the job that looks profitable on paper and loses money in the truck. You quote $6,000 for a furnace swap. The customer signs. Everyone's happy. Then the tech burns six hours instead of four, the supply house run eats half a day, and nobody bills for the $400 in fittings and consumables off the truck. The invoice still reads $6,000. The job cleared $300. That's the false win, and most shops book a dozen of them a week without ever noticing. Your contractor profit margin doesn't die in one big loss. It bleeds out across a hundred jobs that all "looked fine."
Contractor job costing is the discipline of tracking every dollar that goes into a job — labor, materials, overhead, and hidden costs — against what you quoted, so you know your real margin before the books close.
The average net profit for general contractors sits around 5-6%, with top performers hitting 10-12% (Siana Marketing, 2026). That's the real home services profit margin picture, and most owners are stunned when they see where they actually land. The shops that hit the top tier do one thing differently: they track actuals against estimates in real time and earn 15-25% better margins for it. If you want a single number to anchor on, start with the profit per call metric that actually matters.
I've watched a 14-tech HVAC shop in Phoenix book $4.2M in revenue and clear less than $200K. Their quotes looked great. Their reality was a slow bleed. The leak started at intake.
This is the 5-step cheatsheet to fix it. Run it against your last 10 jobs. You'll find the leak inside an hour.
What is the average net profit margin for home service contractors in 2026?
The average net profit margin is 5-6% for the average home services contractor and 10-12% for top performers in 2026 (Siana Marketing, 2026). The difference between the two tiers is almost never pricing. It's discipline. Top performers track actuals against estimates on every job and catch the leaks before they compound. The rest find out at tax time.
Step 1: Fix the intake before you use any contractor job costing template
Job costing starts at the phone. Every other guide on the internet skips this and goes straight to labor math. That's why the math never works. No contractor job costing template can save you if the inputs are garbage.
If your front desk guesses the equipment age, misses access issues, or quotes a price before talking to the actual decision maker, you've already lost. The quote is built on a lie, and you'll spend the rest of the job paying for that lie.
The 8 things every intake call must capture
Exact equipment make, model, and age
Symptom and any prior diagnosis
Access issues (crawl space, attic, second floor, locked gate)
Property type and square footage
Decision maker on site? Yes or no.
Budget signal and financing interest
Source of the lead (Google, referral, Angi)
Urgency window
Skip any of these and your tech rolls up blind. He bids on the spot. He gets it wrong. You eat the difference.
The qualification questions most front desks skip
The basics get captured. The money questions get skipped. Most front desks never ask: "Has anyone else looked at this already?" "Is this a rental or owner-occupied?" "Are you the only decision maker, or is there a partner who signs off?" "What's the worst-case budget you're bracing for?" Those four questions tell you whether you're walking into a real job or a tire-kicker, whether you'll get paid, and whether the tech needs to bring the big truck. Skip them and you're quoting blind on every other line item too.
Sloppy intake doesn't just kill margin. It corrupts your dispatch board too. Here's how dispatch board gaps trace back to bad intake data. And here's the call qualification playbook we use to fix it.
Step 2: Calculate your fully burdened labor rate
This is where most contractors learn how to calculate job cost the hard way: they bill the wage and forget everything stacked on top of it. Your fully burdened labor rate is the only number that tells the truth about what an hour of tech time actually costs you. Get this wrong and every quote you write is wrong by the same margin.
How do I calculate fully burdened labor rate for an HVAC technician?
Your fully burdened labor rate is wages plus payroll taxes plus workers' comp plus benefits plus PTO plus training plus tools, divided by actual production hours. For a $25/hour HVAC tech, the real cost is $38-$42/hour. If you're quoting at $25/hour billable, you're paying customers to use your tech.
Here's the formula:
(Labor Burden Costs + Gross Payroll) ÷ Production Hours = Fully Burdened Hourly Rate
Walk the $25/hour example all the way through. Add payroll taxes (roughly 8%), workers' comp (10% for HVAC), health benefits, PTO, training time, and the tools and phone he carries. That stack adds $13-$17 on top of the base wage. So the tech you "pay $25" actually costs $38-$42 every billable hour. Now subtract the non-billable hours: drive time, supply house runs, the morning meeting, the truck he can't bill while he's restocking it. Your tech is paid for 40 hours but only produces 30 billable ones, which pushes the real cost per produced hour even higher. This is HVAC job costing in one calculation, and it's the line item that quietly sinks the most shops.
BLS data from December 2025 shows the average construction full-time employee costs $107,474 in total compensation: $74,630 in wages and $32,843 in burden — roughly 44% on top of base pay (Construction Coverage, 2025).
Trade-specific workers' comp benchmarks
HVAC techs: 8-12% of payroll
Electricians: 6-10% of payroll
Plumbers: 5-9% of payroll
Those numbers come from NCCI 2025 data (PushLeads). They're not optional line items. They're the cost of having a tech show up.
For a deeper breakdown by region, check the HVAC technician salary benchmarks by state.
Step 3: Count every material, including the ones you forget
Materials and labor together eat 50-80% of total project costs (Siana Marketing). The materials you forget are the ones killing you.
The truck stock problem
Wire nuts. Solder. Tape. Sealant. Filters. PVC fittings. Pipe dope. Wire connectors. Mounting hardware. Refrigerant. Every truck rolls with $3K-$8K of consumables, and most contractors never bill for it. They write it off as overhead and wonder where the cash went. Good plumbing job costing treats every fitting, every foot of PEX, and every roll of tape as a billable line, not a freebie out of the van.
Add disposal fees, permit costs, fuel for the supply house run, and the gear your tech burned through on the job. Bill it or eat it. There's no middle ground.
A simple fix: have techs scan or log consumables against the ticket before they leave the job. The truck restock report becomes your material cost report. No more guessing.
Markup vs. margin: stop confusing them
A 30% markup is not a 30% margin. If a $100 part has a 30% markup, you sell it for $130 and your margin is 23%. To get a real 30% margin, you need to mark it up 43%. Most shops are losing 7-10 points of margin to this single math error.
Build a price book that updates when supplier prices change. Train the team on it. Here's how to do it: flat rate pricing and price book training.
Step 4: Allocate overhead to every job, not just the big ones
Overhead is insurance, vehicles, office rent, marketing spend, admin payroll, software, fuel. It runs 20-45% of revenue for most home service shops. If you lump it at year-end, you'll think small jobs are profitable. They're not. They're subsidized by your big ones.
Why per-job overhead matters
Year-end overhead allocation hides which jobs actually make money. Spread overhead across the whole year and a $300 service call looks profitable because the math never charges it for its share of the building, the trucks, or the dispatcher's salary. Allocate that same overhead per job and the picture flips: the small ticket barely breaks even, the mid-size install carries the company, and the loss-leader "we'll just knock it out" calls are quietly draining your contractor profit margin every week. You can't fix what the books average away. Per-job overhead is how you see each job standing on its own two feet.
The 10-10 rule
Target 10% overhead and 10% profit — a 20% total markup baseline (Siana Marketing). That's the floor for a healthy general contractor. If you're under that, you're not running a business. You're running a charity.
Allocate overhead per labor hour. Take your annual overhead, divide by total production hours across the team, and add that number to your burdened labor rate. Every job carries its share. Every job stands on its own.
Run the math against your last 30 days with the cost per booked job ROI blueprint.
Step 5: Compare estimate vs. actual on every job
The first four steps build a clean estimate. This step is how to calculate job cost after the fact and prove whether the estimate held. Without it, you're flying blind. The estimate is a guess until the actuals confirm it.
Why are my jobs less profitable than my estimates show?
Your jobs are less profitable than your estimates because the estimate was built on bad data and never gets compared to actuals. The fix is a post-job review on every ticket: estimated hours vs. actual hours, estimated materials vs. actual materials, estimated drive time vs. actual drive time.
If your estimates are consistently 15-20% light on labor, that's not bad luck. That's a systematic problem. Fix it at the source — which is the intake call from Step 1.
The post-job review ritual
Every Friday, pull the week's completed jobs. Five-minute review per job:
What did we quote?
What did it actually cost?
Where's the gap?
Is it a one-off or a pattern?
The discipline isn't in the four questions. It's in what you do with the answers. Feed the pattern back to the intake team so the next quote is tighter. If labor runs long on every attic install, your intake script needs an attic-access question. If materials blow out on repipes, your price book is stale. That's the loop, and most shops never train the muscle. The ones that run it weekly stop getting surprised at tax time.
Benchmark your numbers against the revenue per technician benchmarks to see where you actually stand.
The bonus step: stop the leak at the phone
Here's where most contractors get stuck. They buy ServiceTitan or Housecall Pro and assume the software will fix the math. It won't. Those platforms report profit after the fact. They can show you the leak. They can't plug it.
The leak is at intake. The fix is real-time coaching for the human on the phone — guiding them through every qualifying question, every objection, every script. For after-hours and low-value calls, an AI voice agent captures the lead with clean, consistent data. For the high-ticket calls (the $15K HVAC install, the $8K repipe), AI coaches the human in real time and warm-transfers with full context.
Warm transfer matters. Most AI systems on the market can't do it. They drop the call, the customer gets dumped to a cold human, and the booking dies. Here's how AI warm transfer works in home services.
The hybrid model is the only one that respects the math: AI for the routine, coached humans for the revenue. If you want to see where your shop is bleeding, run the home services profit leakage audit.
What are the 5 steps to job costing for a home service contractor?
The 5 steps are: 1) Fix the intake call, 2) Calculate your fully burdened labor rate, 3) Count every material, 4) Allocate overhead to every job, and 5) Compare estimate vs. actual on every job. Run all five in a loop and your real margin stops being a mystery.
Here's the recap:
Step 1: Intake is the source. Capture all 8 data points or eat the loss.
Step 2: Burdened labor is wages + 44%. Quote anything less, you're losing money.
Step 3: Bill every material. Truck stock counts. Markup is not margin.
Step 4: Overhead hits every job. Run the 10-10 rule.
Step 5: Compare estimates to actuals weekly. Close the loop back to intake.
Key Takeaway and Next Step
The 5-step contractor job costing template comes down to five disciplines you run on every job:
Step 1: Fix the intake call. Capture all 8 data points before anyone quotes.
Step 2: Calculate your fully burdened labor rate. Wages plus 44% is the real number.
Step 3: Count every material, including the truck stock and consumables you forget.
Step 4: Allocate overhead to every job, not just the big ones.
Step 5: Compare estimate vs. actual on every job, then feed the gaps back to intake.
None of this is hard math. It's discipline. The contractor who runs this loop monthly knows his real margin. He stops guessing. He stops getting surprised at tax time. He starts building the business he thought he had.
The leak starts at the phone. Fix that, and the rest follows. Book a Tradesly demo and we'll show you how to plug it in 30 days.