Tradesly · Guide
The Dashboard: what happened while you were away
One recap you can act on: calls, texts, bookings, and how the AI did.
You can't watch the phones all day — that's why you have an AI on them. But “someone's handling it” only feels good if you can see what got handled. The Dashboard is that view: one recap of what happened while you were away, short enough to read with coffee and honest enough to act on.
1 The steps
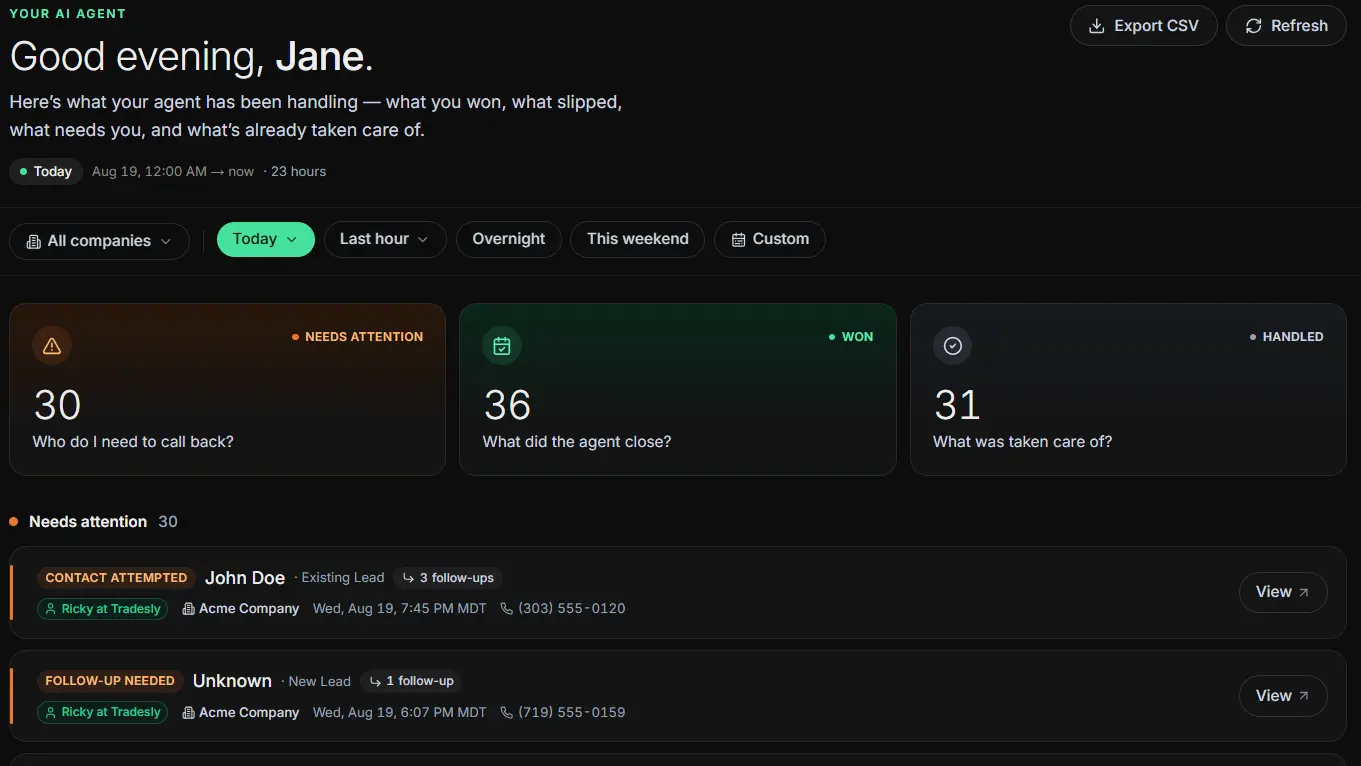
Pick your timeframe first.
Today, Yesterday and Last 7 days are the everyday three; Overnight and This weekend are the two you'll actually reach for; Last hour when something is happening right now, and Custom for the rest.
Read the three buckets, in order.
Needs attention answers “who do I need to call back?”, Won answers “what did the agent close?”, and Handled answers “what was taken care of?”
Click the bucket that bothers you.
They're clickable — you land on the actual conversations behind the number, not a chart about them.
Scan the vitals underneath.
AI-handled, Calls handled, Answer rate, Avg. speed to answer, Avg. call length, Total call time and Escalations. Answer rate and speed to answer are where jobs are won and lost.
Let the page update while you watch.
If a recent conversation has not appeared yet, wait briefly and use the page’s refresh control once before contacting support.
Press Export CSV when the numbers need to travel.
Into a spreadsheet, a weekly report, or your bookkeeper's inbox.
2 What the recap shows
Pick a timeframe and use the three buckets as a work queue:
- Needs attention — open these first and decide who owns the next action.
- Won — review completed customer commitments and confirm any operational follow-up.
- Handled — sample these when you want to check quality or understand what happened.
All three are clickable, so no number is a dead end — you can always get from the count to the conversations that made it.
Under the buckets sit the visible vitals: AI-handled, Calls handled, Answer rate, Avg. speed to answer, Avg. call length, Total call time and Escalations. Use them to spot a period worth opening, not to diagnose a cause from a single number. Compare like-for-like timeframes and read the conversations behind a change before adjusting staffing or coaching.
Every time on the page is shown in the company's timezone — “8:15 PM” means 8:15 where your customers live, wherever you happen to be reading from.
3 How to actually use it
The Dashboard rewards a rhythm more than a stare:
- Morning: open it on Yesterday, or Overnight if you close at six. Clear Needs attention before anything else, then glance at Won.
- Monday: open it on Last 7 days. This is the version worth bringing to a team huddle: what came in, what we won, and whether Answer rate held.
- When something felt off: the recap is how you check a hunch. “The phones felt quiet Thursday” is a feeling; a Custom range over Thursday is a fact.
If the AI's numbers point at something you'd like it to handle differently, that's a coaching moment, not a settings hunt — see Meet your AI team.
4 More than one company
If a company picker appears, select the company you intend to review before reading or exporting the recap. Confirm the name again when moving between brands so you do not attribute one company’s activity to another. Group view and brand view covers the available views for a multi-brand account.
5 Taking the numbers with you
Export CSV downloads the current report selection for further review. Check the chosen timeframe and company before exporting, store the file according to your data handling policy, and avoid emailing customer-level data when a summary is sufficient.